

SUPDEM Indicator MT4 v2: Ultimate Guide to Supply & Demand Zone
Learn how to use the automated Supply and Demand Zone Indicator (SUPDEM v2) for MT4 like a pro. Discover how to install, interpret, and trade using supply and demand zones with practical strategies, examples, and tips.
In this comprehensive guide, we'll teach you how the SUPDEM Supply and Demand Indicator for MT4 works, and how to use it to identify strong trading zones as well as expert strategies, tips, and examples for better accuracy and profitability.
Introduction
Trading in the foreign exchange market is ultimately about identifying where price is likely to reverse or continue — and nothing captures this idea more clearly than supply and demand zones.
While traditional traders focus only on support and resistance lines, experienced price action traders know that zones — not single lines — are what actually move markets.
This is where the SUPDEM indicator for MetaTrader 4 (MT4) comes in.
It automates the identification of these critical zones, giving traders a clear view of where institutional orders might be sitting, and where potential reversals or breakouts are most likely to happen.
In this comprehensive guide, we’ll break down everything you need to know about the SUPDEM Supply and Demand Indicator for MT4 — from how it works and how to install it, to practical trading techniques and advanced confluences you can use to strengthen your entries.
Table of Contents
-
What Are Supply and Demand Zones?
-
Understanding the SUPDEM Indicator
-
How to Install the SUPDEM Indicator on MT4
-
Key Features and Parameters Explained
-
How to Read and Interpret SUPDEM Zones
-
How to Trade Using the SUPDEM Indicator
-
Entry Techniques
-
Stop Loss & Take Profit Placement
-
Multi-timeframe Strategy
-
-
Advanced Trading Tips & Confluences
-
Common Mistakes to Avoid
-
Pros and Cons of the SUPDEM Indicator
-
Best Settings and Optimization
-
Combining SUPDEM with Other Indicators
-
Real Chart Example & Case Study
-
Frequently Asked Questions (FAQ)
-
Final Thoughts
1. What Are Supply and Demand Zones?
Supply and Demand Zones represent the footprints of institutional trading activity — areas where large orders from banks, hedge funds, or big traders have previously pushed price strongly in one direction.
-
Supply Zone = an area where selling pressure exceeds buying power.
-
Demand Zone = an area where buying pressure exceeds selling pressure.
When price returns to these zones, there’s a high probability that large traders will defend their positions, causing a reversal or temporary pause in price movement.
Imagine it like this:
-
Supply zones are “wholesale areas” where professionals sell to retail buyers.
-
Demand zones are “discount zones” where professionals buy from retail sellers.
Example:
If EUR/USD rallies sharply after touching 1.0650–1.0670, that area forms a demand zone.
If price later retraces back into that area and bounces again, that zone is considered “respected.”

2. Understanding the SUPDEM Indicator
The SUPDEM indicator (short for Supply and Demand) automatically detects these zones for you and marks them directly on your MT4 chart.
It analyzes past price data to identify where sharp moves began, assuming that these strong price moves were driven by institutional order flow — and therefore likely to be respected again in the future.
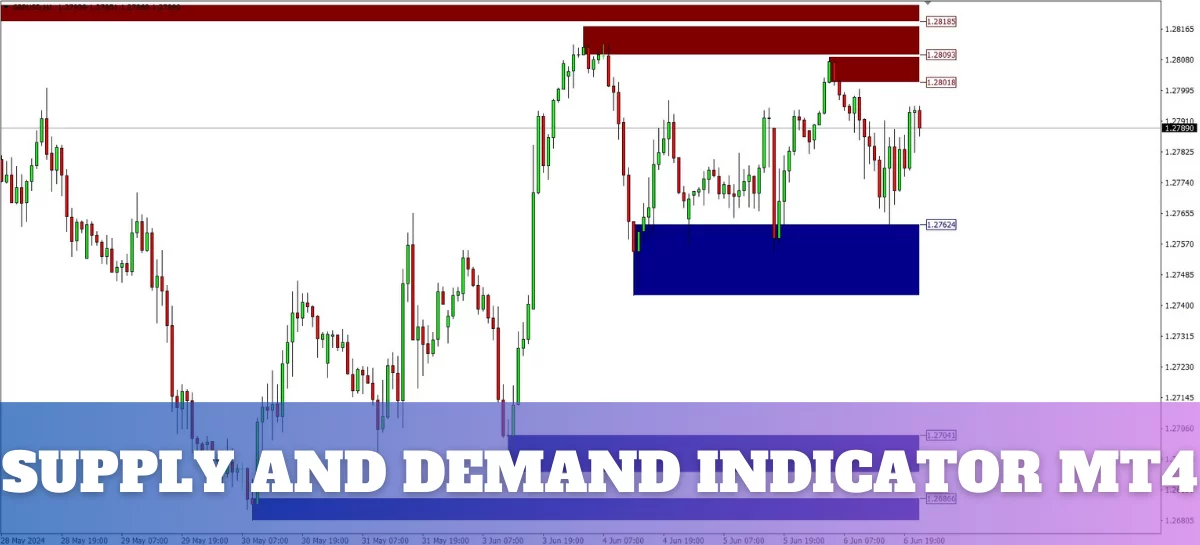
When installed, the SUPDEM indicator will show:
-
Red zones – representing Supply (resistance) areas.
-
Green or Blue zones – representing Demand (support) areas.
Each zone is plotted as a rectangle that extends to the right, showing the potential region where price may react again.
The indicator updates dynamically:
-
When price breaks a zone convincingly, that zone disappears or shifts.
-
When new areas of imbalance form, new zones are drawn.
This makes SUPDEM ideal for both manual traders who want visual clarity, and automated strategists who use zones as confluences in EA or algorithmic systems.

3. How to Install the SUPDEM Indicator on MT4
Installing the SUPDEM indicator on MT4 is straightforward.
Step-by-Step Installation Guide:
-
Download the SUPDEM Indicator File
You can download the.ex4file from the link below.
Download SUPDEM Indicator for MT4) -
Copy the File into MT4 Folder
-
Open MT4
-
Click
File→Open Data Folder -
Go to
MQL4→Indicators -
Paste the downloaded file there
-
-
Restart MT4
Close and reopen MT4 to load the new indicator. -
Attach to Chart
-
Open any chart (EUR/USD, GBP/USD, etc.)
-
Navigate to
Navigator→Indicators -
Double-click SUPDEM to attach it
-
Once applied, you’ll immediately see the colored zones appear across your chart.

4. Key Features and Parameters Explained
The SUPDEM indicator usually comes with several parameters that allow you to customize how zones are detected and displayed.
Here’s what the main ones mean:
-
Fresh Zones Only – When true, the indicator only shows the latest untested zones.
-
Max Zones Displayed – Limits how many zones appear on the chart.
-
Zone Strength – Determines how strong a move must be to qualify as a zone (measured in candle momentum or pip distance).
-
Timeframe Sensitivity – Adjusts how far back the indicator looks for swing points.
-
Zone Color – Allows you to customize the visual color for supply and demand zones.
By fine-tuning these settings, you can make the chart cleaner and focus only on the most significant imbalances — which is key for professional trading.

5. How to Read and Interpret SUPDEM Zones
Understanding how to interpret the SUPDEM zones correctly is crucial.
A zone itself is not a signal — it’s a potential reaction area.
When price approaches one of these zones, traders analyze the reaction behavior:
-
Does price slow down?
-
Are there wicks or rejection candles?
-
Is there divergence or volume exhaustion?
If yes, the zone is confirmed, and traders can plan their entries.
Reading Tips:
-
The wider the zone, the stronger the past move was.
-
Zones that caused sharp, clean moves tend to hold better.
-
If price breaks through a zone without rejection, it’s considered invalid.
-
Zones that align across multiple timeframes are much stronger (e.g., a 4H zone aligning with a 1H zone).

6. How to Trade Using the SUPDEM Indicator
The SUPDEM indicator gives you the visual structure of the market, but how you use that information determines your success.
Let’s walk through exactly how to trade using SUPDEM — from identifying key zones to executing precise entries.
6.1 Identifying Tradable Zones
Start by observing where the indicator has plotted its freshest zones.
A good practice is to trade from the edges — not the middle — of the zones.
-
When price approaches a demand zone, look for buy opportunities.
-
When price approaches a supply zone, look for sell opportunities.
However, not all zones are equal. Focus only on strong, untested zones that caused a sharp impulse (long candles with minimal wicks).
Tip:
Use the 4H chart for overall trend direction, 1H for zone validation, and 15M for entry precision.
6.2 Entry Techniques
There are three primary ways to enter trades using the SUPDEM zones:
1. Confirmation Entry
Wait for the price to enter the zone and form a rejection candle or engulfing pattern before entering.
This method filters out false reactions but sometimes causes you to miss the earliest entry.
2. Limit Order Entry
Place a buy limit (at demand) or sell limit (at supply) order directly at the zone’s boundary.
Best for traders who understand zone reliability, but it carries higher risk if price overshoots the zone.
3. Break and Retest
Wait for price to break above a supply zone or below a demand zone — then trade the retest as the new structure forms.
This suits trend-following traders who prefer confirmation over catching reversals.
Example:
If EUR/USD is in an uptrend and price retraces to a strong 4H demand zone around 1.0670, you might:
-
Drop to the 15M chart
-
Wait for a bullish engulfing candle or market structure shift
-
Enter long
-
Set stop loss below the zone and target 2–3x the risk

6.3 Stop Loss & Take Profit Placement
Proper risk management is critical when trading supply and demand.
-
Stop Loss:
Always place your stop loss a few pips beyond the zone. For demand zones, it goes below; for supply zones, above. -
Take Profit:
Common approaches:-
Target the opposite zone
-
Use a 2R–3R risk/reward ratio
-
Use trailing stop once price leaves the zone
-
This keeps trades consistent and avoids being stopped out by temporary volatility.
6.4 Multi-Timeframe Strategy
The real power of the SUPDEM indicator is unlocked when you use it across multiple timeframes.
Here’s a powerful 3-step structure you can follow:
Step 1: Identify Trend Direction (4H Chart)
Mark whether the market is in an uptrend or downtrend using price structure:
-
Uptrend = Higher Highs & Higher Lows
-
Downtrend = Lower Highs & Lower Lows
Step 2: Find Key Zone (1H Chart)
Locate the major fresh zone that aligns with the direction from Step 1.
For example:
-
In an uptrend, look for a demand zone
-
In a downtrend, look for a supply zone
Step 3: Refine Entry (15M or 5M Chart)
Wait for price to tap into that 1H zone. Then, on the lower timeframe, wait for confirmation such as:
-
Bullish/Bearish engulfing
-
Break of structure (BOS)
-
Retest of micro-zone
This method gives you tight stop losses, strong confluences, and high probability entries.
7. Advanced Trading Tips & Confluences
The SUPDEM indicator becomes even more powerful when you combine it with other smart confluences.
Below are advanced ways to refine your accuracy:
7.1 Combine with Moving Averages (EMA 50 & 200)
The 50 and 200 EMAs help you align your trades with the overall momentum.
-
Buy only at demand zones above both EMAs.
-
Sell only at supply zones below both EMAs.
This filters out trades that go against the dominant trend.
7.2 Fibonacci Retracement Confluence
Draw your Fibonacci retracement from the swing high to swing low (or vice versa).
If a demand or supply zone aligns with a 38.2%, 50%, or 61.8% retracement, that zone has higher reliability.
This works especially well during trending conditions where pullbacks respect structure.

7.3 Imbalance and Fair Value Gaps (FVGs)
SUPDEM zones often align with areas of imbalance — regions where price moved too quickly and left unfilled orders behind.
Marking these gaps alongside SUPDEM gives you more context about where price might rebalance before continuation.
7.4 Volume and Candlestick Confirmation
Use volume spikes or candle formations like pin bars, hammer candles, and engulfing patterns to confirm institutional participation within a zone.
7.5 Higher Timeframe Alignment
When a lower timeframe zone (like 1H) coincides with a higher timeframe zone (like 4H or Daily), the probability of a reaction increases drastically.
This is called multi-timeframe confluence, and it’s one of the strongest setups supply-demand traders use.
8. Common Mistakes to Avoid
Even though SUPDEM simplifies zone identification, traders still make costly mistakes. Here are some to avoid:
-
Trading Every Zone You See – Not every zone is valid. Focus on zones that caused strong impulsive moves.
-
Ignoring the Trend – Always align your trades with the higher timeframe trend.
-
No Confirmation Entry – Entering blindly without candle confirmation increases loss probability.
-
Overlapping Zones – If zones are too close, the market is consolidating; wait for a breakout.
-
Neglecting Freshness – The more times price touches a zone, the weaker it becomes. Trade fresh, untouched zones for best results.
9. Pros and Cons of the SUPDEM Indicator
Pros
-
Automates zone detection, saving analysis time
-
Highlights key institutional areas visually
-
Helps traders see market structure more clearly
-
Works across all timeframes and assets
-
Great for both beginners and advanced traders
Cons
-
May repaint (zones can shift after strong breakouts)
-
Requires confirmation to avoid false reactions
-
Can clutter charts if too many zones are active
-
Settings need adjustment for different pairs or volatility
10. Best Settings and Optimization
The SUPDEM indicator has flexible settings, but the best configuration depends on your trading style and the market you’re analyzing.
Below are the recommended configurations that most professional traders use to balance clarity, accuracy, and chart cleanliness.
10.1 Recommended General Settings
| Setting | Recommended Value | Description |
|---|---|---|
| Fresh Zones Only | True | Shows only the latest active zones |
| Max Zones | 3–5 | Prevents clutter and focuses on strongest areas |
| Zone Strength | 25–40 | Detects significant momentum-based zones |
| Lookback Period | 300–500 candles | Ensures the indicator uses relevant recent data |
| Zone Width | Auto | Lets the indicator adjust based on volatility |
These parameters can be tuned slightly depending on the pair (e.g., EUR/USD vs. GBP/JPY) and timeframe.
10.2 Scalping vs. Swing Settings
-
For Scalping (5M–15M):
-
Zone Strength: 15–25
-
Max Zones: 2–3
-
Fresh Zones: True
-
Smaller zones for quick reactions
-
-
For Swing Trading (4H–Daily):
-
Zone Strength: 35–60
-
Max Zones: 3–5
-
Fresh Zones: False (include tested zones)
-
Broader zones that show longer-term order flow
-
10.3 Pair-Specific Adjustments
-
Major Pairs (EUR/USD, GBP/USD): Use default strength and lookback.
-
JPY Pairs: Increase zone strength slightly to filter out volatility noise.
-
Commodities (Gold, Oil): Expand lookback to 700+ candles for more reliable zones.
11. Combining SUPDEM with Other Indicators
While SUPDEM can stand alone, combining it with a few select tools can enhance your precision.
11.1 SUPDEM + RSI Divergence
Use RSI (Relative Strength Index) to confirm potential reversals within zones:
-
If price hits a supply zone and RSI shows bearish divergence, that’s strong confluence for a short.
-
If price hits a demand zone with bullish divergence, it signals possible reversal strength.
I use MACD divergence in the below picture though.

11.2 SUPDEM + Market Structure
Mark swing highs and lows manually to confirm how price behaves inside and after each zone.
When market structure shifts (e.g., a lower low after touching supply), it strengthens your entry logic.
11.3 SUPDEM + Volume Profile
If your platform supports it, combine SUPDEM zones with a volume profile tool to see whether a zone aligns with high or low-volume areas.
-
High volume at demand = accumulation.
-
High volume at supply = distribution.
12. Real Chart Example & Case Study
Let’s walk through a realistic trading scenario to see how SUPDEM can be applied step-by-step.
Scenario: GBP/USD 4H Chart
-
Trend Identification:
The market is forming higher highs and higher lows — clear uptrend. -
Zone Identification:
SUPDEM plots a fresh demand zone around 1.2570–1.2590, where price last made a strong bullish push. -
Confluence Check:
-
50 EMA crosses above 200 EMA → bullish confirmation
-
Fibonacci 61.8% retracement aligns perfectly with the demand zone
-
RSI approaching oversold
-
-
Entry Setup:
Drop to 15M chart — bullish engulfing candle forms at the top of the demand zone.
Enter long position. -
Stop Loss & Target:
-
Stop loss: 20 pips below the demand zone
-
Take profit: next visible supply zone on 4H chart (about 80 pips higher)
-
-
Result:
Trade hits full take profit in under 24 hours.
This simple yet structured approach shows how powerful SUPDEM becomes when combined with disciplined analysis.
13. Frequently Asked Questions (FAQ)
Q1: Does the SUPDEM indicator repaint?
Yes, to a degree. When price breaks through a zone, the indicator removes or adjusts that zone. This is normal because market structure evolves constantly.
Q2: Is the SUPDEM indicator free?
There are both free and paid versions. Free versions on forums or websites like IndicatorSpot and PriceActionNinja work fine, though premium ones may include alerts and extra features.
Q3: Can I use SUPDEM on other markets besides Forex?
Absolutely. SUPDEM works for indices, commodities, and crypto, as long as the chart runs on MT4.
Q4: What is the best timeframe to use SUPDEM?
For trend trading — 4H and 1H are ideal.
For intraday or scalping — 15M and 5M give better precision.
Q5: Can I combine SUPDEM with Smart Money Concepts (SMC)?
Yes. SUPDEM zones often overlap with institutional order blocks and imbalance areas, making it a great visual confirmation tool for SMC traders.
14. Final Thoughts
The SUPDEM Supply and Demand Zone Indicator for MT4 is a powerful way to visualize institutional footprints and trade in sync with the big players.
By understanding where strong buying or selling imbalances occurred, you can anticipate high-probability reversals and continuations.
However, remember this key principle:
The indicator is only a guide — your real edge comes from context, patience, and confirmation.
Use SUPDEM as a supporting framework within your broader strategy. Combine it with trend analysis, EMAs, Fibonacci levels, and candle patterns for the best results.
As you gain more screen time, you’ll start noticing how price respects these zones repeatedly — a sign that you’re beginning to read the market like the professionals do.
Recommended Next Steps
-
Backtest the SUPDEM strategy across different pairs and timeframes.
-
Fine-tune your settings and journal which types of zones work best.
-
Add SUPDEM to your existing trading playbook alongside structure and EMAs.
-
Continue practicing zone reactions until it becomes second nature.
Download Link
You can download the SUPDEM Indicator for MT4 from the link below and experiment with it on your charts:
Download SUPDEM Indicator for MT4
Author’s Note:
This definitive guide was written exclusively by and for novasvet.com, combining price action principles, institutional logic, and modern trading techniques.
Every section was crafted to help traders not just use the SUPDEM indicator — but understand the psychology behind supply and demand trading itself.