

The Ultimate Guide to Fibonacci Retracement: From Beginner Basics to Advanced Execution
Stop guessing where the market will turn. Master Fibonacci Retracements with this Novasvet complete guide covering how to draw them, the "Golden Zone" strategy, and advanced confluence setups for Forex, Crypto, and Stocks.
Introduction
If you spend enough time looking at price charts, you start to notice something strange. Markets don't move in straight lines. They breathe. They surge forward, pull back to catch their breath, and then surge again.
For new traders, that "pullback" is terrifying. Is the trend over? Is the market crashing? For professional traders, that pullback is an invitation. They see an opportunity to enter a proven trend at a discount.
This opportunity is precisely what the Fibonacci Retracement tool helps you identify. It is arguably the most popular, yet most misunderstood, tool in technical analysis. Based on a universal mathematical constant known as the Golden Ratio, Fibonacci levels (like the critical 61.8% and 50%) act as powerful magnetic zones for price action in Forex, Crypto, and Stock markets.
Whether you are placing your first trade or seeking to refine your swing trading strategy, this guide moves beyond the basic definitions. We will show you exactly how to draw Fibonacci correctly, identify the high-probability "Golden Zone" for entries, and integrate advanced concepts like confluence and extensions to turn a simple pullback into a consistently profitable trade setup.
The Ultimate Guide to Fibonacci Retracement: Master the Market’s Natural Rhythm
If you spend enough time looking at price charts, you start to notice something strange. Markets don't move in straight lines. They breathe. They surge forward, pull back to catch their breath, and then surge again.
For new traders, that "pullback" is terrifying. Is the trend over? Is the market crashing? For professional traders, that pullback is an invitation.
This is where the Fibonacci Retracement tool comes in. It is arguably the most popular, yet most misunderstood tool in technical analysis. Some treat it like magic; others dismiss it as voodoo. The truth lies somewhere in the middle: it is a powerful measure of crowd psychology.
Whether you are placing your first trade or managing a six-figure portfolio, this guide will move beyond the basic definitions found on most websites. We are going to dismantle the tool, explain why it works, and show you exactly how to trade it with professional precision.
Part 1: The "Why" (For Beginners & Skeptics)
Before we draw a single line, you need to understand what we are looking at.
The Fibonacci sequence (1, 1, 2, 3, 5, 8, 13...) acts as the mathematical DNA of the universe, appearing in everything from nautilus shells to galaxy spirals. In trading, we aren't counting rabbit populations; we are looking at the ratios derived from these numbers.
Why do these ratios matter on a chart? Because humans trade markets. Humans are patterns. When a stock or currency pair shoots up and starts to drop, traders collectively look for a "value" price to get back in.
These retracement levels act as self-fulfilling prophecies. Because millions of traders, algorithms, and banks are watching these specific levels, they tend to react there.
The Key Levels You Must Know
While the tool gives you many lines, you only need to care about a few specific ones. We can categorize them into tiers of importance:
-
The Golden Ratio (61.8%): This is the heavyweight champion. If a trend is healthy, deep pullbacks often terminate here.
-
The 50% Level: Note: This is not actually a Fibonacci number. However, according to Dow Theory, markets rarely retrace more than half of a primary move without reversing. It is a major psychological barrier.
-
The Shallow Retracement (38.2%): In extremely strong, aggressive trends, price often won't drop deep. It taps the 38.2% and rockets away.
-
The "Line in the Sand" (78.6% or 88.6%): Often used by advanced traders as the "last stand" before a trade setup is invalidated.
Part 2: The Art of Drawing "Fibs" Correctly
This is where 90% of traders fail. If you draw the tool incorrectly, your data is garbage.
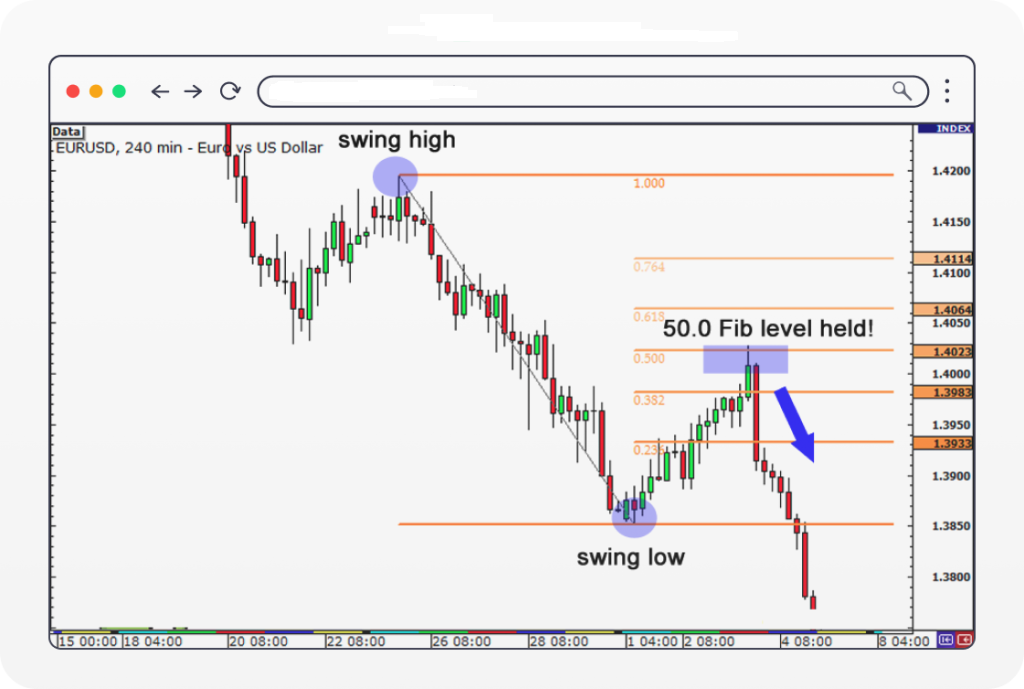
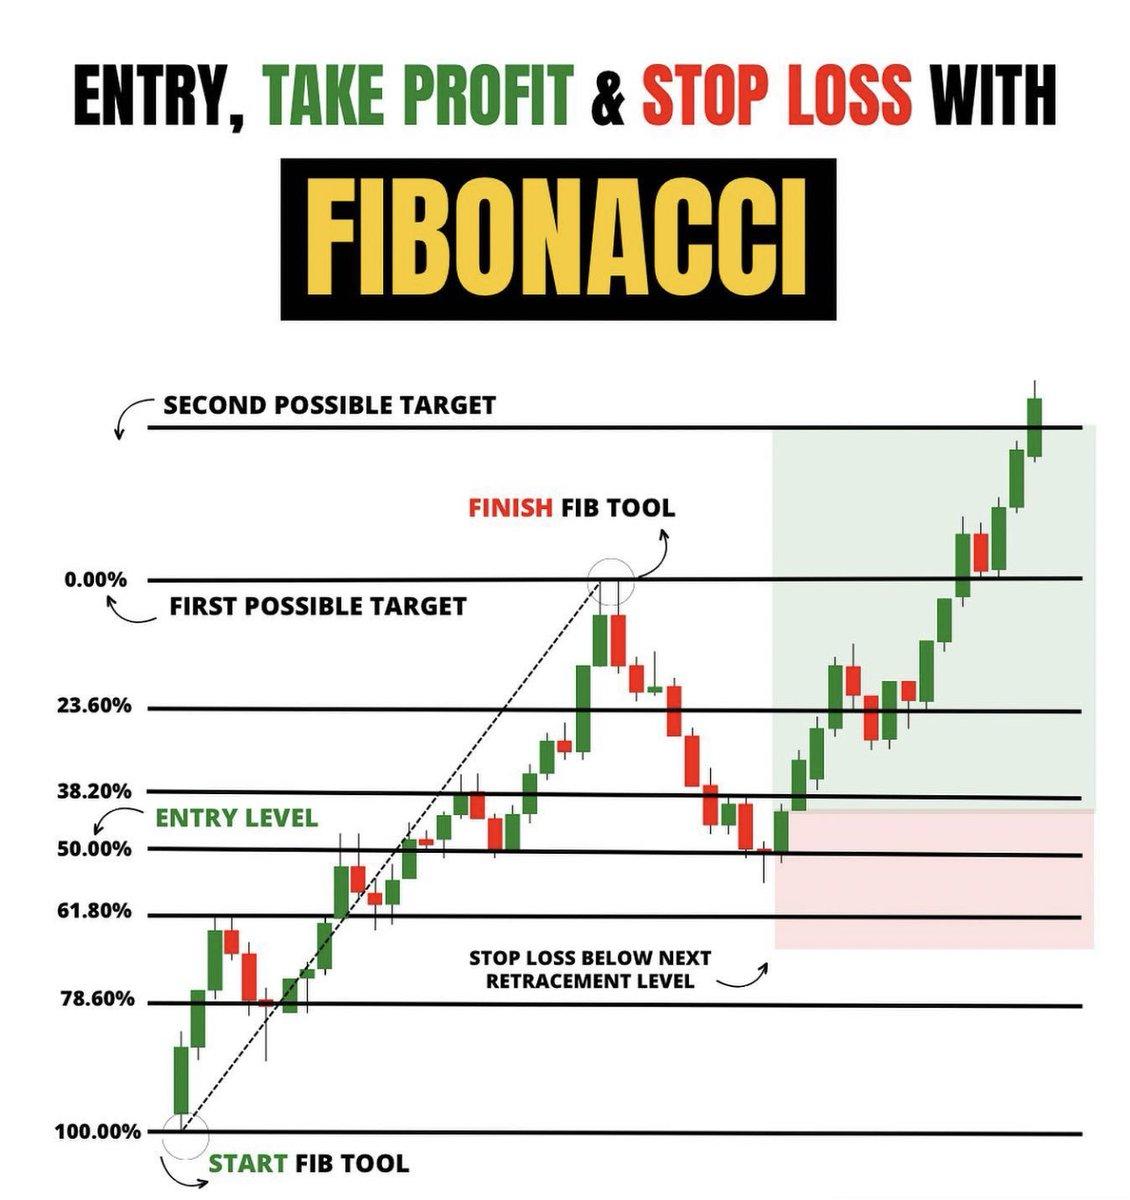
The Fibonacci tool measures a specific move: The Swing High to The Swing Low.
The Rules of the Draw
-
In an Uptrend: Click on the absolute bottom (Swing Low) and drag the tool to the absolute top (Swing High). You want to measure how far down price dips.
-
In a Downtrend: Click on the absolute top (Swing High) and drag down to the absolute bottom (Swing Low). You want to measure how high price rallies.
The Great Debate: Wicks vs. Bodies
Should you draw from the very tip of the candlestick wick, or the body where the candle closed?
The Verdict: Stick to the Wicks. High-frequency algorithms and stop-hunts react to the extreme highs and lows of price. By using the wicks, you ensure you are capturing the entire range of the market sentiment during that move.
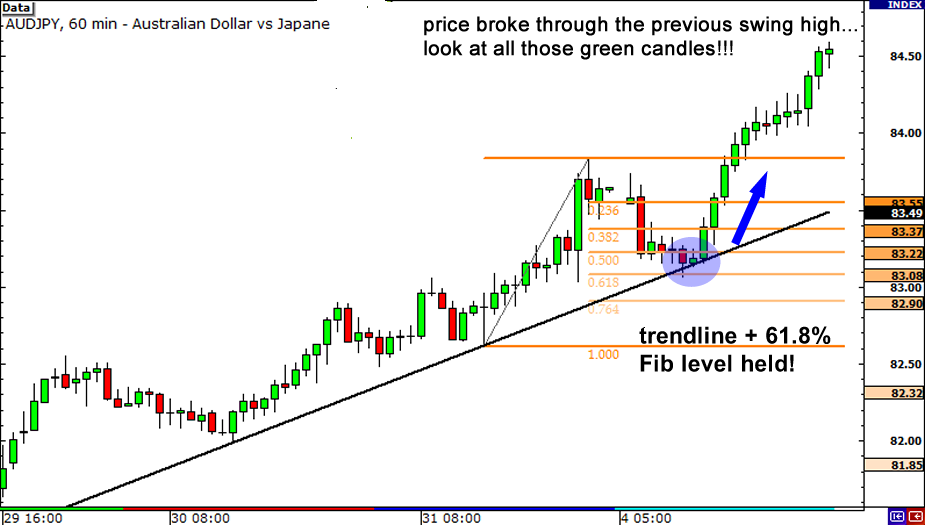
Part 3: The "Golden Zone" Strategy (Intermediate)
Now that we can draw them, how do we trade them?
A common mistake is placing a "Limit Order" exactly on the 61.8% line and hoping for the best. That is catching a falling knife. Instead, we treat the area between the 50% and the 61.8% as a "Kill Zone" or "Golden Zone."
We do not buy the line; we buy the reaction at the line.
The Step-by-Step Execution:
-
Identify the Trend: Is the market making Higher Highs? (Only look for buys).
-
Wait for the Pullback: Do not chase the pump. Let the price come to you.
-
Watch the Zone: As price enters the 50%-61.8% area, slow down.
-
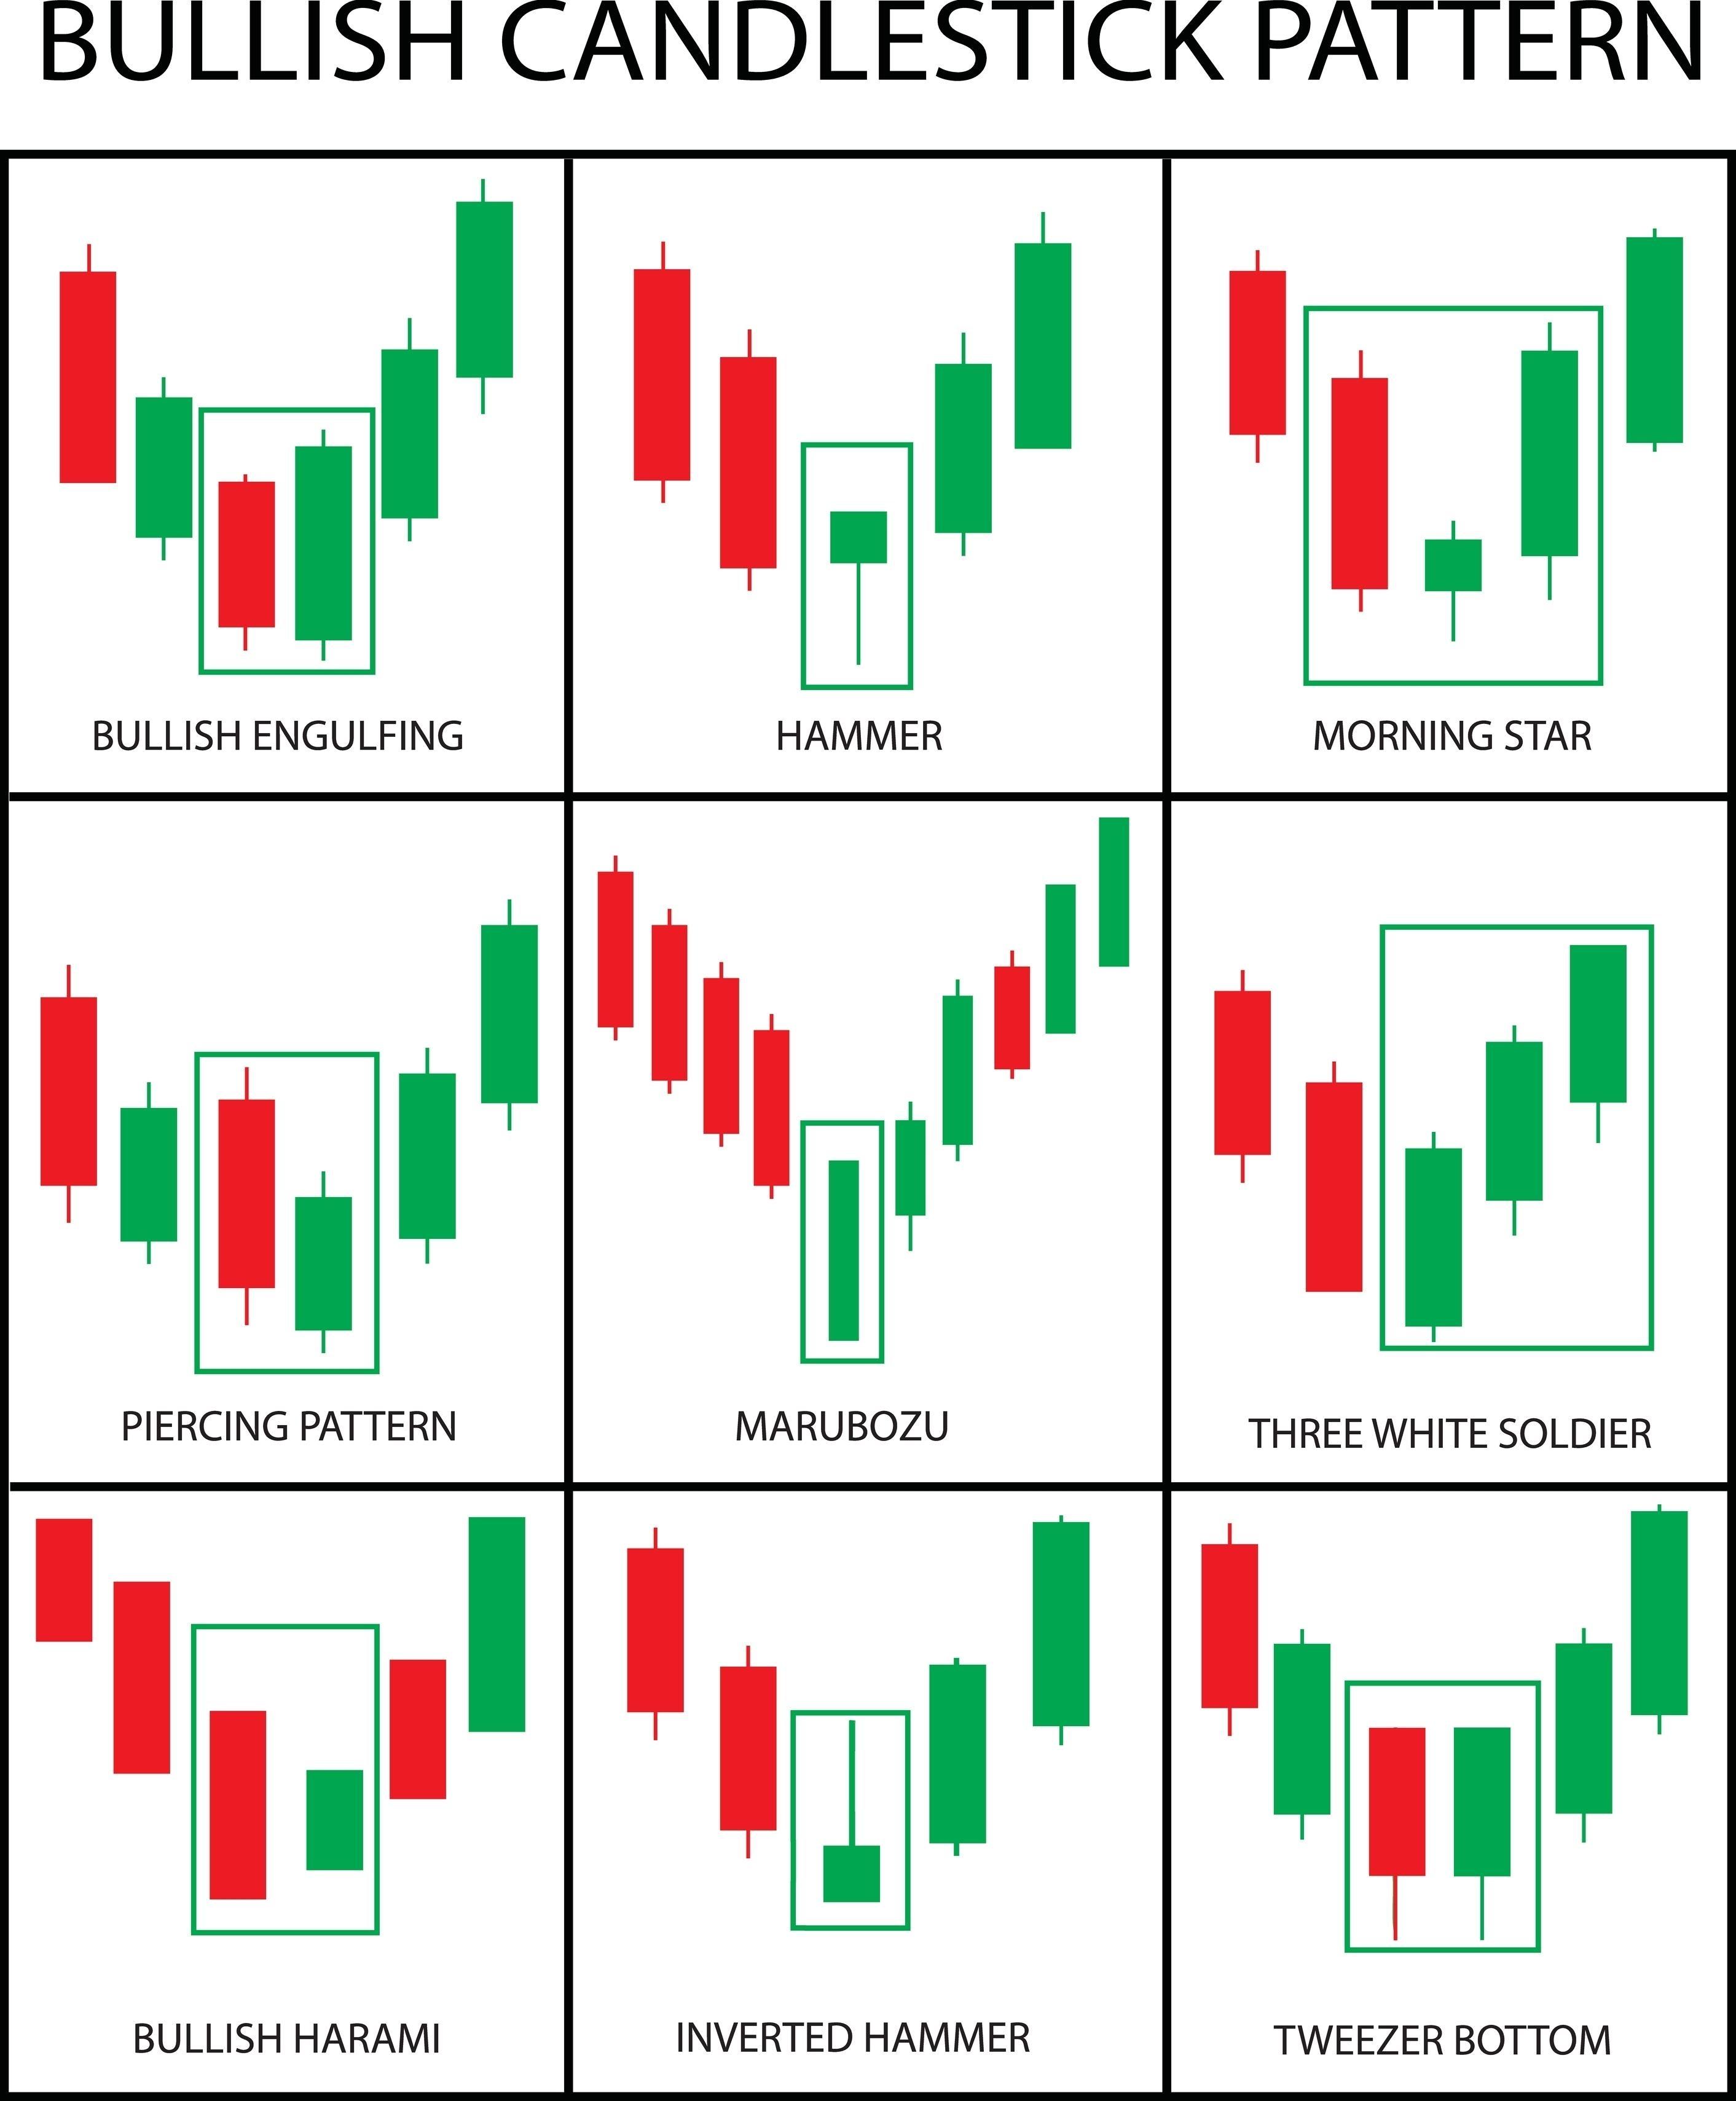
The Trigger: Look for a reversal candlestick pattern.
-
Pin Bar / Hammer: A long wick rejecting the level.
-
Engulfing Candle: A strong move back in the direction of the trend.
-
Doji: Indecision slowing down the momentum.
-
If the price smashes through the 61.8% like a hot knife through butter, do not trade. The setup has failed.
Part 4: Powerhouse Confluence (Advanced Application)
This section is for the traders who want to increase their win rate.
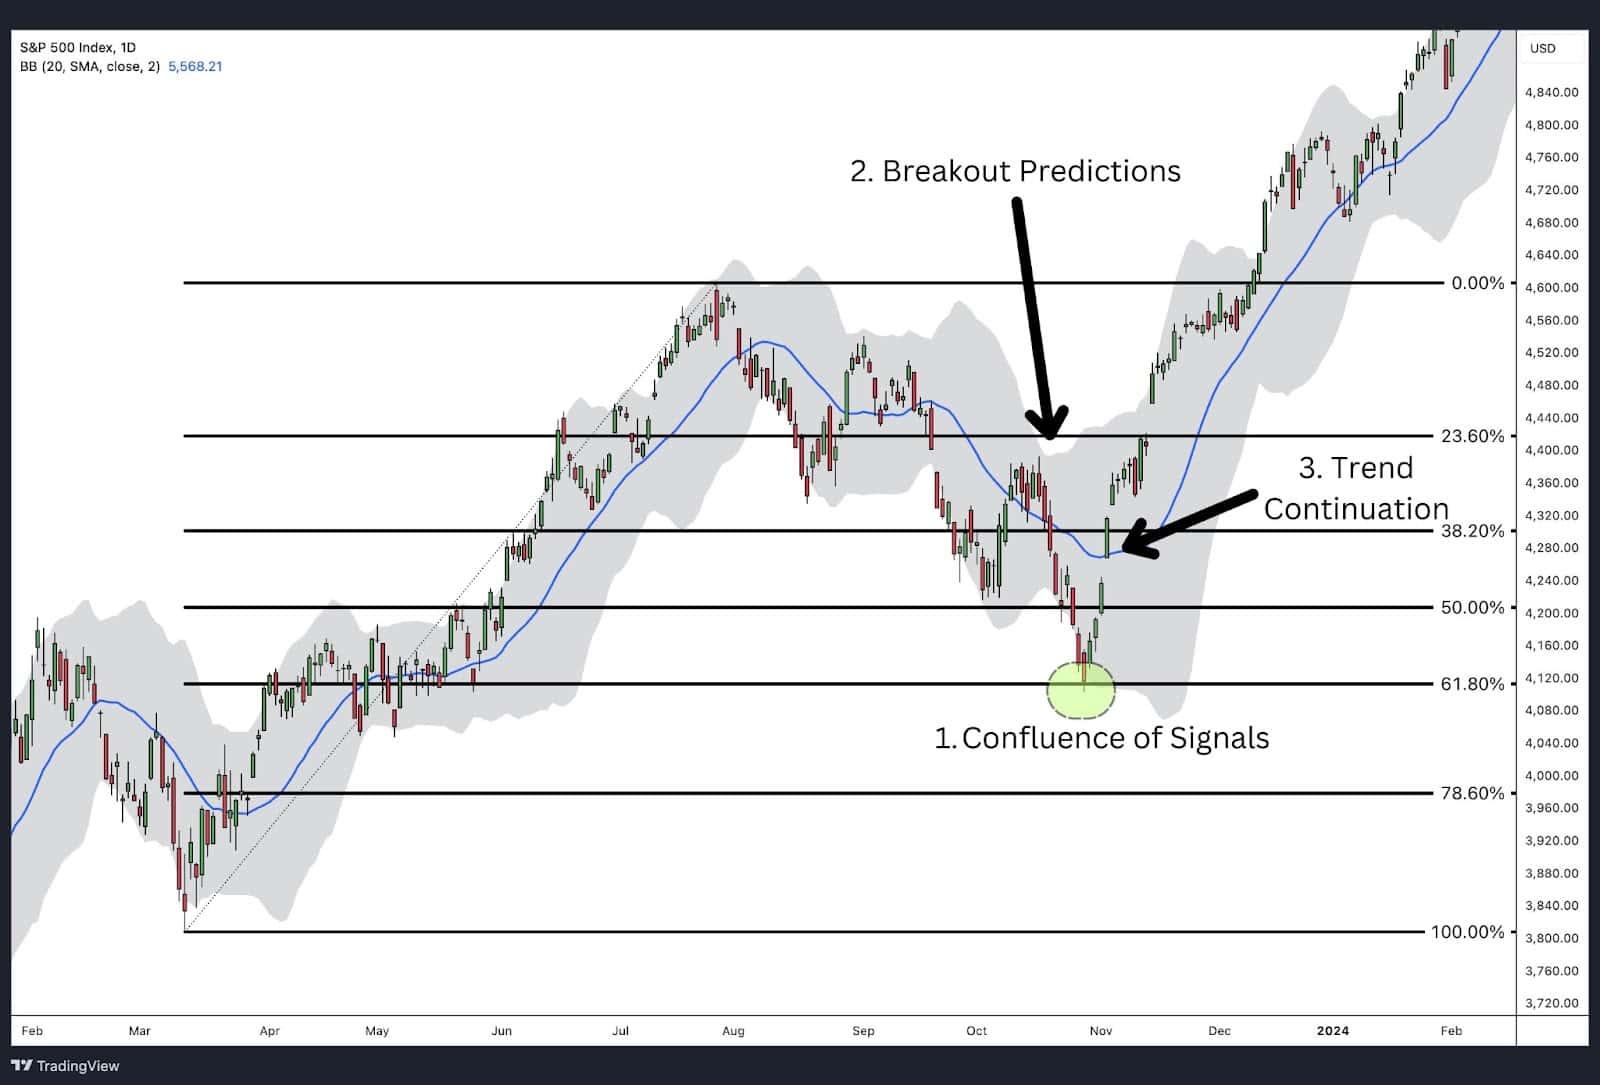
Trading Fibonacci in isolation is risky. It works best when it has friends. This concept is called Confluence. When multiple independent analysis tools point to the same price level, that level becomes concrete.
Here is how you turn a "good" trade into a "great" trade:
1. Structure Confluence (The "Role Reversal")
Look left. Does your 61.8% retracement level line up perfectly with a previous Resistance level that was broken? When old Resistance becomes new Support exactly at a Fibonacci level, that is a high-probability setup.
2. Trendline Confluence
Draw a trendline connecting the previous lows. If the trendline intersects with the 50% or 61.8% level at the exact moment price arrives, you have a dual-layer of defense.
3. Moving Average Confluence
Enable your 200-period or 50-period Moving Average. These act as dynamic support. If price hits the 61.8% Fib and bounces off the 200 EMA simultaneously, the algorithmic buying pressure will be massive.
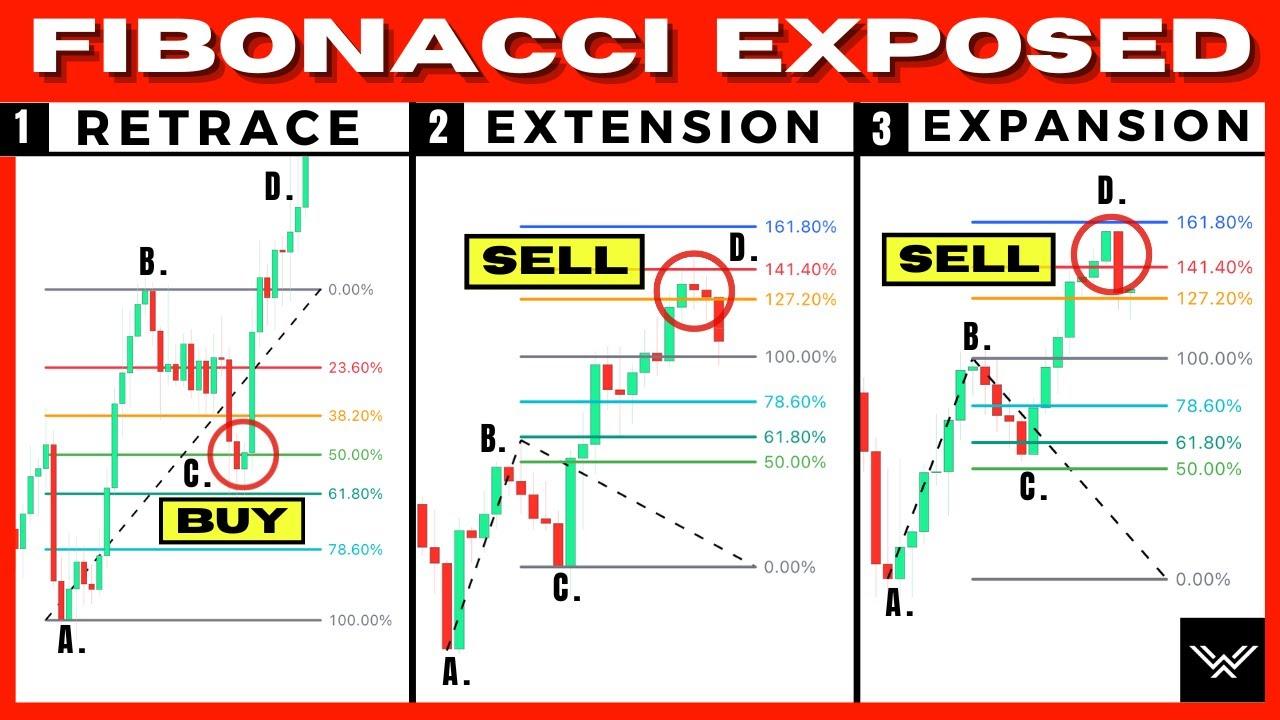
Part 5: Where to Exit? (Fibonacci Extensions)
Beginners ask, "Where do I enter?" Pros ask, "Where do I get out?"
You can use the Fibonacci tool for profit targets as well. These are called Extensions. When you draw your retracement, you will often see levels like -0.27, -0.618, or 1.618.
-
Target 1 (Safe): The recent Swing High (0.0 level). This is where the price began to fall.
-
Target 2 (Runner): The -0.27 extension. This assumes the trend will continue and break the previous high.
-
Target 3 (Moonbag): The 1.618 extension. This is for powerful, extended trends.
Pro Tip: Take 70% of your profit at Target 1, move your stop loss to breakeven, and let the remaining 30% ride to the extensions. This guarantees a winning trade while leaving room for a home run.
Part 6: The Invalidations (Risk Management)
We cannot talk about profit without talking about pain. Where does the Stop Loss go?
If you are buying at the 61.8% level, your trade idea is that the trend will resume. If price drops all the way below the Swing Low (the 100% level), your thesis is wrong.
-
Aggressive Stop: Just below the 78.6% level (Tight stop, higher reward, higher risk of being wicked out).
-
Conservative Stop: Just below the original Swing Low (100%). If price breaks this, the trend is officially over.
The Golden Rule: Never risk more than 1-2% of your account on a single Fib setup, no matter how perfect the confluence looks.
Conclusion: It’s a Tool, not a Crystal Ball
Fibonacci Retracement is a vital addition to your trading arsenal. It helps you tame the chaos of the market and provides a structure to the noise.
However, remember this: The market does not owe you a bounce at the 61.8%.
The best traders use Fibonacci to frame their risk, not to predict the future. Use it to find areas of value, wait for price action to confirm your bias, and manage your risk strictly. That is the difference between gambling and trading.
Ready to practice? Open your chart, find a clear trend from the last week, and practice drawing the levels from Swing Low to Swing High. You’ll be surprised how often price respects the invisible lines.